How Long Will the $20 Million Plan Hold?
A Thrive65 look at the district’s own five-year forecast: if the Board adopts the full plan, how many years before the budget gap returns?
The short answer
The administration’s plan would close about $20.9 million a year in costs starting July 2027. Without it, the district’s own forecast runs out of reserves during FY2030. With it, the budget is stable for about three years, and then the gap returns:
- FY2030 is the first year spending (including the yearly transfer for building repairs) exceeds revenue again.
- FY2031 is when reserves fall below the Board’s goal of 90 days of operating costs.
- FY2032 is when reserves drop below where they are today, matching the district’s own chart.
The plan buys time. It does not change the underlying math, and the community should expect another round of hard choices around FY2030 unless revenue or costs change.
The numbers, year by year
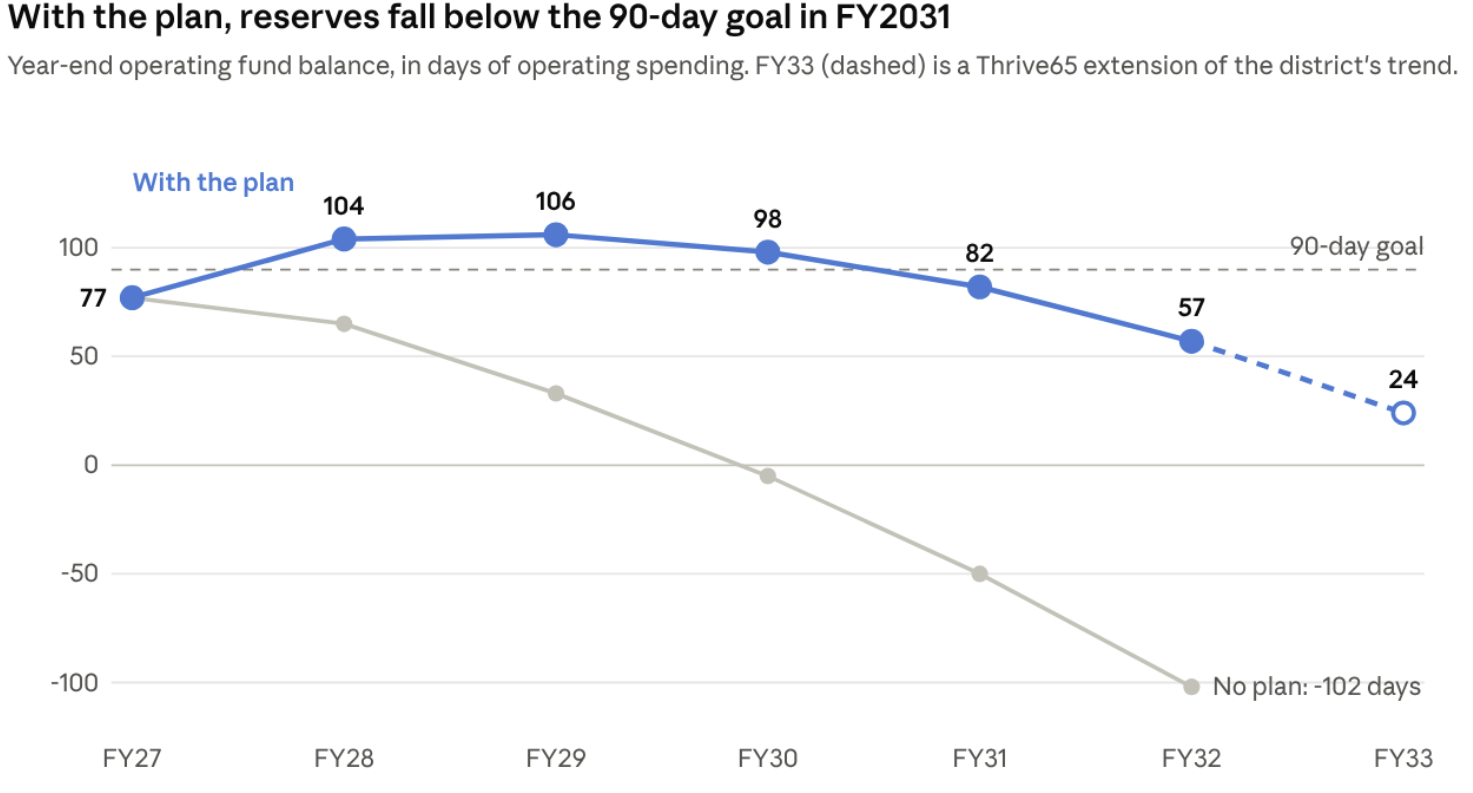
District Projection Summary (base scenario, Aug. 2026) and FY28 plan assumptions (Oct. 2026); with-plan line is Thrive65’s reconstruction, FY27-FY33
| Fiscal year | Revenue | Spending + building transfer | Surplus / (deficit) | Year-end reserves |
|---|---|---|---|---|
| FY2027 (budget) | $179.9M | $185.0M | ($5.1M) | $38.0M |
| FY2028 | $190.8M | $178.4M | $12.4M | $50.4M |
| FY2029 | $194.1M | $190.2M | $3.9M | $54.3M |
| FY2030 | $199.0M | $200.1M | ($1.1M) | $53.2M |
| FY2031 | $204.2M | $210.7M | ($6.5M) | $46.7M |
| FY2032 | $209.4M | $221.9M | ($12.5M) | $34.2M |
| FY2033 (estimate) | $214.8M | $233.8M | ($18.9M) | $15.2M |
“Reserves” here means the year-end balance of the district’s operating funds. Each year includes the plan’s $4 million to $5 million in added building and curriculum spending, and the $2.4 million yearly transfer for capital repairs. Without the plan, the district’s own forecast shows reserves below zero in FY2030.
Why the gap comes back
The plan lowers the district’s costs once. It does not change how fast those costs grow compared with revenue:
- Revenue grows about 2.5% a year. Most of it is local property tax, which state law caps at the rate of inflation (the district assumes 3%) plus new construction. State and federal aid are held flat.
- Spending grows about 5.5% a year. Salaries rise about 5% a year under current contract terms (raises plus experience “steps”). Benefits rise about 10% a year, driven by health insurance (assumed up 12% a year before the plan’s redesign) and pensions (up 6%).
- The plan also adds spending on purpose: about $4 million to $5 million a year for building repairs and new curriculum, after years of deferred maintenance.
When spending grows twice as fast as revenue, any one-time reset wears off. By FY2033, people costs (salaries and benefits) would be about three-quarters of all spending, so future choices will again come back to staffing, health plans and contracts, or to new revenue.
What this means
None of this is a reason to reject the plan. Without it, the district’s own forecast shows it unable to meet its obligations during FY2030. But families and staff deserve to know that a plan this disruptive buys about three years of stability, not a permanent fix.
- Expect the next conversation around FY2030. That is roughly the end of a new superintendent’s second or third year. Naming this now means the next leader is not blamed for a gap we can already see coming.
- Ask the district to publish the with-plan forecast in full, year by year and including FY2033 and beyond, and to update it every budget cycle. The district has shown a chart, but not the table behind it.
- Watch the assumptions that move the most money: health insurance growth, the next teacher contract (the forecast assumes current terms continue), and whether enrollment keeps falling.
- Plan revenue and cost together. A future facilities referendum (being explored for November 2028) would fund buildings, not the yearly operating gap. Keeping the operating budget stable past FY2030 will take continued cost discipline, new operating revenue, or both.
How we estimated this
We started from the district’s base forecast (FY2027 budget through FY2032, covering the Education, Operations and Maintenance, Transportation, IMRF/Social Security, Working Cash and Tort funds). We applied the plan’s revenue gains, spending cuts and added investments as listed in the district’s projection assumptions. We added the $2.4 million yearly capital transfer the district shows. FY2033 extends each line at its FY2031 to FY2032 growth rate.
Our year-end reserves track the district’s own “with plan” fund balance chart within about $1.3 million each year. That difference is the same every year, which suggests a small difference in the FY2027 starting balance. “Days” divides year-end reserves by a year of spending, the way the Board’s 90-day goal is usually measured. Reserves are a fund balance, not a bank balance, and real cash moves with the timing of property tax payments.
These are planning estimates. They will change with the final plan, the next teacher contract, health insurance costs and enrollment.
Sources: D65, Projection Summary, base scenario without intervention (Frontline Analytics, August 2026); D65, Financial Projection Assumptions (October 2026); D65, FY28 Proposed Financial Improvement Plan, Data Share (October 7, 2026); D65, “Projected Fund Balance (Operating Funds),” Board presentation, October 13, 2026. With-plan figures and the FY2033 estimate are Thrive65 calculations.