Closing Lincolnwood and Dewey would raise K-5 building utilization from about 62% this year to 76% in fall 2027, using the district’s capacity method. The increase comes almost entirely from removing seats, not from changes in enrollment:
| K-5 schools (excluding King Arts), district method | 2026-27 | 2027-28 (proposed) | Change |
|---|---|---|---|
| Enrollment (excluding STEP and RISE) | ~3,160 | 3,101 | −2% |
| Capacity (seats) | ~5,130 | 4,098 | −20% |
| Utilization | ~62% | 75.7% | +14 points |
The district’s Board resolution uses 75% K-5 utilization as its test, and the plan clears it by less than one point. Several receiving schools would run noticeably fuller: Willard rises from 53% to 88%, Walker to 83% and Oakton to 81%.
Utilization by school
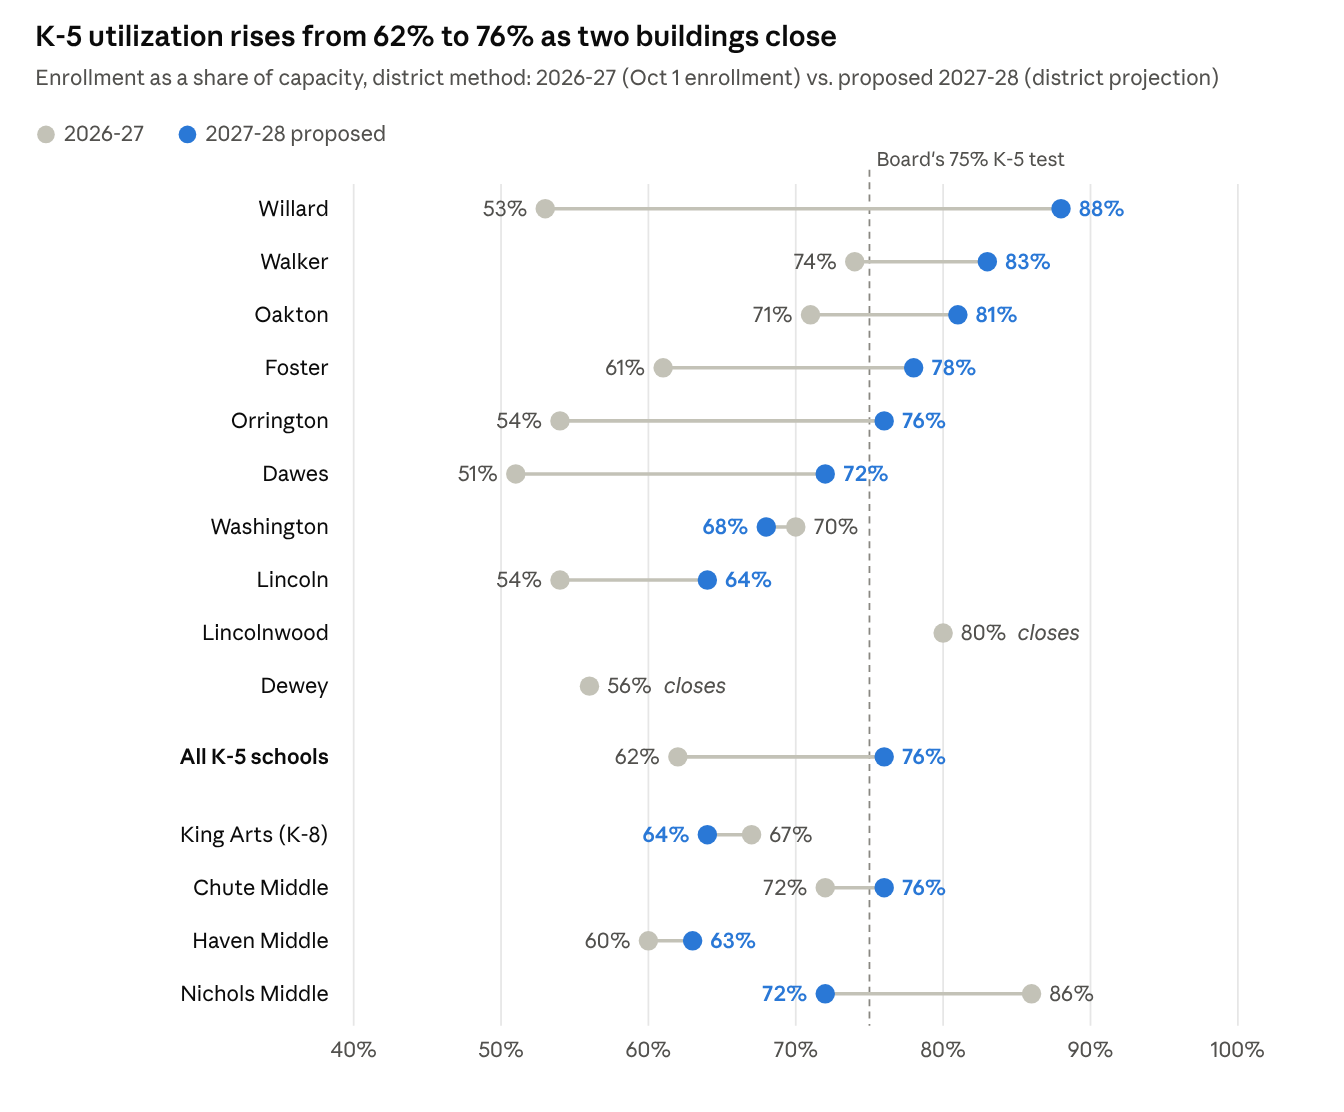
D65 Utilization table (FY28) and Oct 1, 2026 enrollment; 2026-27 capacities for Dewey and Lincolnwood are Thrive65 estimates using the district’s method
Seven of the eight remaining K-5 schools get fuller; Washington dips slightly. Middle schools barely move, except Nichols’ projected drop.
By school
| School | Capacity 2026-27 | Capacity 2027-28 | Enrolled Oct 1, 2026 | Projected fall 2027 | Change |
|---|---|---|---|---|---|
| Willard | 512 | 512 | 271 | 452 | +181 |
| Walker | 432 | 432 | 318 | 357 | +39 |
| Oakton | 514 | 514 | 366 | 417 | +51 |
| Foster | 576 | 576 | 353 | 447 | +94 |
| Orrington | ~456* | 360 (gains STEP) | 247 | 274 | +27 |
| Dawes | 552 | 552 | 284 | 395 | +111 |
| Washington (STEP) | 528 | 528 | 380 | 359 | −21 |
| Lincoln (STEP) | 624 | 624 | 340 | 400 | +60 |
| Lincolnwood (STEP) | ~384* | closes | 331 | — | |
| Dewey | 556 | closes | 314 | — | |
| K-5 total | ~5,130 | 4,098 | 3,204 | 3,101 | −103 |
| King Arts (K-8 magnet, RISE) | 658 | 658 | 443 | 424 | −19 |
| Chute Middle | 818 | 818 | 588 | 618 | +30 |
| Haven Middle | 1,008 | 1,008 | 601 | 638 | +37 |
| Nichols Middle | 664 | 664 | 570 | 479 | −91 |
*Thrive65 estimate using the district’s method; the district published 2027-28 capacities only. The district’s method sets aside STEP classrooms plus a clinician room (4 rooms at Lincoln, Washington and, next year, Orrington). We applied the same 4-room set-aside to Lincolnwood this year (384 seats), and none to Orrington this year because it has no STEP program until fall 2027 (19 classrooms, 456 seats).
Because capacity excludes STEP rooms, this year’s utilization percentages leave out STEP students (24 at Lincolnwood, 13 at Washington, fewer than 10 at Lincoln, per the district’s October 2026 program counts), matching how the district’s fall 2027 projections are built. Nichols’ projected drop from 570 to 479 is the district’s figure; the posted files don’t explain it.
Average class size
General education classes would average roughly 20-23 students in fall 2027, up from about 19 this year. Two-way immersion (TWI) classes average about 16 and African-Centered Curriculum (ACC) classes about 12 (ACC sometimes combines grades, which means fewer, larger classes), the same both years, because each program strand needs its own class at every grade even when it is not full. STEP’s small self-contained classes are left out of all three averages.
| School (programs) | Gen ed 2026-27 (by grade) | Gen ed 2027-28 | TWI | ACC | Homerooms 2027-28 (gen ed + program) |
|---|---|---|---|---|---|
| Lincoln (TWI from Dewey next year) | 20 | 17-23 | 17 (next year) | 13-18 + 6 | |
| Walker | 21 | 20-24 | 15-18 | ||
| Willard | 21 | 19-24 | 19-24 | ||
| Oakton (1 TWI, 1 ACC) | 18 | 22 | 13 | 12 | 12 + 12 |
| Orrington | 18 | 23 | 12 | ||
| Foster (2 TWI) | 17 | 21-23 | 17 | 11-12 + 12 | |
| Dawes (1 TWI) | 17 | 23 | 19 | 12 + 6 | |
| Washington (2 TWI) | 16 | 14-23 | 16 | 7-12 + 12 | |
| Lincolnwood | 21 | closes | |||
| Dewey (1 TWI) | 18 | closes | 17 (this year) | ||
| King Arts (grades K-5) | 20 | ||||
| All K-5 schools | 19 | 20-23 | 16 | 12 | 101-120 + 48 |
- General education classes fill up most. Closing two schools removes partly filled neighborhood classes, so the low end of the range rises from about 18 to 20. Dawes, Oakton and Orrington would run near 23.
- Program classes stay small, and that sets the floor on cost. TWI averages about 16 across 7 strands (42 classes), from about 13 at Oakton to about 19 at Dawes. Oakton’s ACC strand averages about 12 if it runs one class per grade, or closer to 18-24 if it combines grades (for example, 3-4 multi-grade classes); its TWI strand averages about 13.
- Washington is the outlier. Its two TWI strands use 12 homerooms, leaving about 165 neighborhood students for as few as 7 classes; neighborhood classes could average as low as 14 if it keeps one per grade.
- Willard and Walker carry the most uncertainty. Their neighborhood enrollment sits just above a full strand, so averages depend on whether the school adds an extra class at every grade (lower) or only where needed (higher).
How we estimated this: each TWI or ACC strand = one class per grade (6 classes). Program enrollments for TWI are 2026-27 actual enrollment on the district’s data site. Both are held constant next year. General education = school enrollment minus program and STEP students. Its range runs from whole strands (one more class at every grade) to the fewest classes needed at the contract guideline average of 24. 2026-27 general education averages use actual enrollment by grade minus each school’s TWI, ACC, and STEP students, spread evenly across grades, with classes capped at the contract guidelines (23 in K-2, 25 in grades 3-5). ACC may combine grades, which would mean fewer, larger classes than shown. Grades are assumed equal in size; actual sections are set grade by grade, and program sizes may have shifted since the SDRP table.
How capacity is counted
The district counts each building’s capacity two ways and uses the lower one:
- By room size: classroom square footage at 48 sq ft per kindergartner and 36 sq ft per student in grades 1-8.
- By classroom count: classrooms times the teachers’ contract class-size guidelines (23 in K-2, 25 in grades 3-5, 28 in grades 6-8; 24 is used as the K-5 average).
It removes one room per building for art, and removes STEP and RISE classrooms (plus a clinician room) and their students. For this round it also began counting every classroom over 550 sq ft, rather than only rooms in multiples of six, which adds seats and lowers utilization. The district notes that programs such as two-way immersion and the African-Centered Curriculum need their own classrooms, so a building can run short of rooms before its utilization rate looks high.
Questions to ask
- Many in the community have expressed concern about being rezoned from a school they can see from their house to a school further away. Given that no school is at the 90% mark, wouldn’t it be feasible to have fewer students move unnecessarily? Could the same be true for families whose middle school will otherwise change too?
- How many classrooms will STEP, RISE, TWI and ACC use at each school in fall 2027?
- At higher utilized schools, will music, small-group intervention and special education services (resource rooms, speech, OT) still have dedicated rooms or move to shared spaces? The capacity count reserves only one room per building, for art.
- How many students moving have IEPs? Has consideration been made as to the impact of changing schools, especially for those whose current school is not closing or for those close to middle school who would change feeder patterns?
Sources
- D65, Utilization table (FY28) and Capacity and Utilization Calculations, October 2026
- D65, School Enrollments, October 1, 2026
- D65, Building Classrooms (StudioGC), used for Dewey and Lincolnwood capacity estimates
- D65, 10-Year Enrollment by Feeder and FY27 Baseline Scorecard raw values
- D65, Students Not Attending Home School, October 6, 2026