The plan cuts $2.4M a year from busing, mostly by narrowing who rides in preschool . Busing stays for students in RISE, STEP, Park, Rice, and King Arts, and for every student whose IEP (individualized education program) includes transportation. The district has not published whether closing Lincolnwood and Dewey adds riders; its model says closure-related busing will “partially offset” savings.
What we know, what we estimate
- District figures: the $2.4M in busing cuts, the FY28 eligible-rider table, the hazard roads, and today’s bus zones.
- Thrive65 estimates, checked against district data: how much of each school’s boundary is walkable or bus-eligible. Our method reproduces today’s bus zones with 99.5% agreement and lands within about 5-15% of the district’s FY28 rider counts where boundaries drive busing.
- Thrive65 estimates we cannot check: headcounts of children with long walks and of added bus riders. These assume that children are evenly distributed across each area, so we show them as rounded ranges.
- Only the district can tell us: exact counts from student addresses, and how many riders are program students (such as two-way immersion at Foster) rather than neighborhood children.
What changes
| Change | Savings | Who is affected |
|---|---|---|
| Preschool for All busing limited to children with an IEP or free/reduced-price lunch eligibility | $700K | Preschool families above the lunch-eligibility income line |
| Rebid contracts and better routing | $560K | Mostly behind the scenes |
| End Head Start busing (with the program handoff, July 2028) | $550K | Head Start families; savings land in FY29, not FY28 |
| Fewer non-required bus aides | $225K | Riders on routes that lose an aide |
| End the district-paid driver attendance bonus | $200K | Bus drivers; may affect driver retention |
| Summer routes only for IEP and lunch-eligible students | $165K | Other summer-program families |
| Total | $2.4M |
Who rides
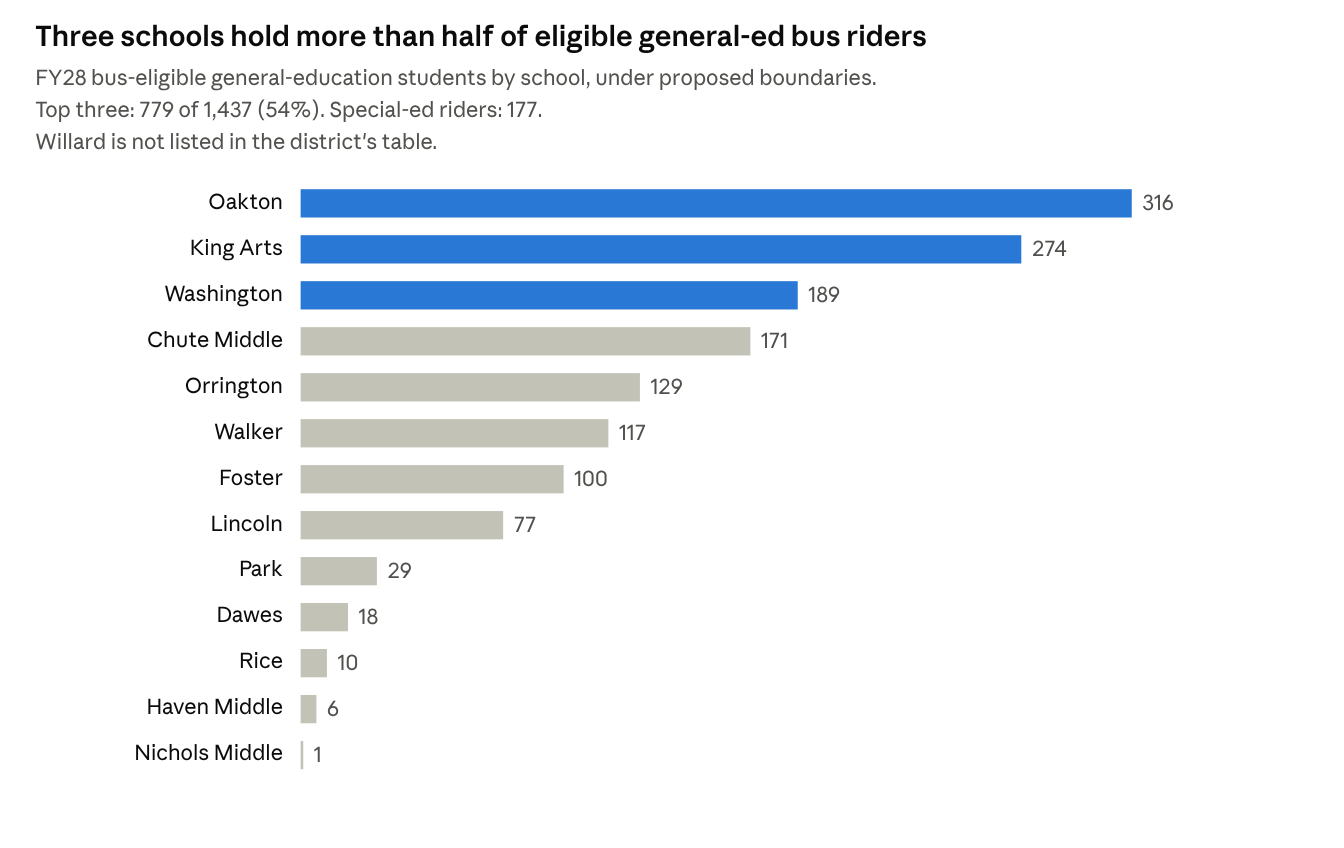
D65, Transportation Numbers (FY28 eligible riders, Oct 7, 2026)
Riders cluster at schools whose boundaries cross hazard roads, plus King Arts, a districtwide magnet. Oakton’s and Washington’s riders mostly live inside their own boundaries but must cross Ridge or Dempster. Foster’s 100 riders are likely mostly two-way immersion students from outside its boundary.
Prior to the Board’s decision to make Ridge a designated hazard, most of those Oakton students were not bus-eligible and crossed with crossing guards. Only non-neighborhood ACC and eligible IEP students were bussed. Similarly, prior to the new boundaries, Washington and Dawes had no bus-eligible gen-ed students.
Walking after the closures
Every remaining school’s boundary gets less walkable, and districtwide the share of elementary land with a short, safe walk falls from 58% to 47%. We routed every part of each attendance area to its school along actual streets, sidewalks and footpaths, and counted a walk as “safe” only if it is 0.75 miles or less and crosses none of the district’s hazard roads (Dempster, Golf, Green Bay, McCormick, Ridge).
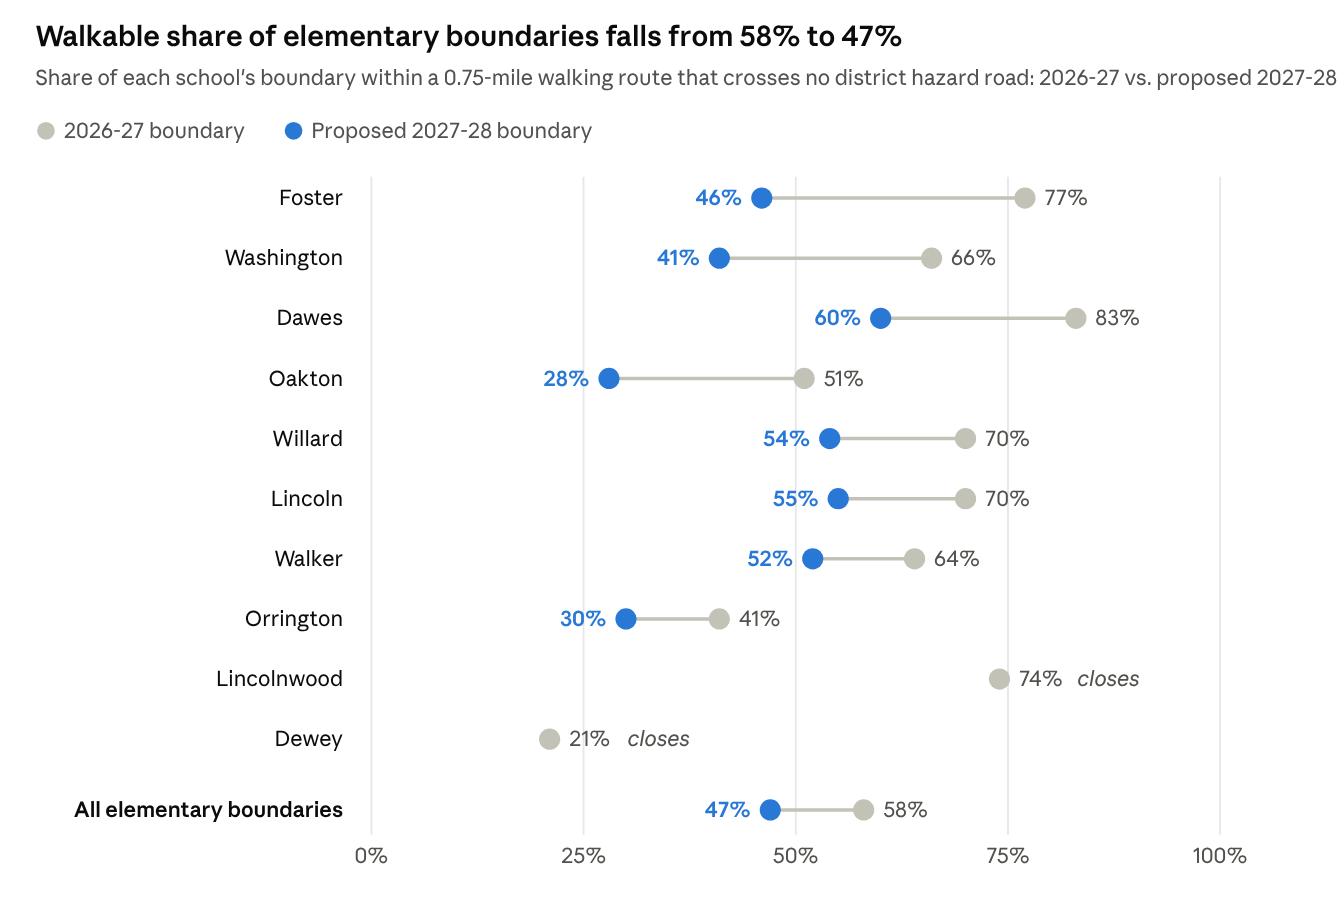
Thrive65 estimate: D65 FY28 tentative boundaries and FY27 bus-zone map (school locations, hazard roads); walking routes on OpenStreetMap streets and paths · share of land
| Estimated K-5 students (rounded range, ±15%) | Now | Fall 2027 |
|---|---|---|
| Short, safe walk (0.75 mi or less, no hazard road) | 1,700-2,300 | 1,250-1,650 |
| Long walk, no bus (0.75-1.5 mi, no hazard road) | 500-700 | 750-1,000 |
| Bus-eligible (crosses a hazard road, or over 1.5 mi) | 525-700 | 675-900 |
- Dewey families. Today 64% of the Dewey area is bus-eligible because children cross Dempster, Ridge or Green Bay to reach Dewey. After reassignment only about 25% would be, and about 68% would face a 0.75-1.5 mile walk with no bus. The median walk rises from 0.80 to 1.04 miles.
- Lincolnwood families. The median walk rises from 0.58 to 0.93 miles. About 46% of the area would have a long walk with no bus; about 31%, mostly those sent to Walker across McCormick or Golf, become bus-eligible.
- Long walks with no bus grow most at Foster (22% to 48% of its area), Dawes (17% to 40%), Willard (30% to 46%) and Lincoln (30% to 43%), roughly 150-225 children at each school by fall 2027. No hazard road stands between these families and their school, so none qualify for a bus.
- Busing grows most at Washington (14% to 59% of its area, crossing Dempster) and Oakton (47% to 71%, crossing Ridge). Our rider estimates for both are close to the district’s own FY28 counts (189 and 316).
- Known blind spots. Foster’s district rider count (100) is far above what its boundary explains (about 30), most likely because of two-way immersion students who live outside the boundary. At Washington our method may overcount neighborhood riders: we estimate about 215, above the district’s 189 total, likely because we spread all of Washington’s enrollment, including its roughly 75 two-way immersion students from outside the boundary, evenly across its neighborhood.
The closures add some busing, roughly 140-190 more eligible riders; the district has not published what serving them would cost. They add about twice as many children, roughly 250-330, to the group that is too far to walk comfortably but does not qualify for a bus.
How we estimated this: we divided each attendance area into roughly 200-foot squares and routed each to its school on the OpenStreetMap walking network (streets, sidewalks, footpaths, bridges). Hazard roads and school locations come from the district’s FY27 bus-zone map; Emerson, Chicago Avenue and Gross Point are not counted: Emerson is not a designated hazard road, and Chicago Avenue and Gross Point, designated by the district in February 2026, do not appear on the FY27 bus-zone map, so today’s bus zones don’t yet reflect them (Lincoln, which straddles Chicago Avenue, has no bus zone). Counting them would add roughly 100 bus-eligible children in fall 2027, mostly at Lincoln. Crossing guards do not change bus eligibility in the district’s practice: about 44% of today’s bus-zone land could reach school within 1.5 miles through a guarded crossing on Ridge or Green Bay and is bused anyway, so we treat guards the same way. This method reproduces today’s bus zones with 99.5% agreement. Student counts spread each school’s enrollment (October 2026, or the district’s FY28 projection) evenly over its area, so treat them as approximate; program and transfer students are included. Map data © OpenStreetMap contributors (ODbL).
- What the district hasn’t published. Its scorecard method scores walkability, state-designated hazards within 1.5 miles, and bus need for each closure scenario, but those results for Lincolnwood and Dewey are not posted. The FY28 rider table also lists no row for Willard, the school taking the most new students; that likely means zero eligible riders, since Willard has no bus zone today and our routing finds almost none, but the district should confirm. The table also gives no current-year comparison, though the scenario for closing Kingsley last year estimated 47 TWI students bussed at Willard.
These are careful estimates from public maps. The district has the exact numbers from student addresses, and we are asking it to publish them before the Board votes.
Questions to ask
- Will the district publish the walkability, hazard-crossing and bus-need scores for the Lincolnwood and Dewey scenario?
- How many current riders are there by school, including Willard, and how many more does the closure plan add? What does that cost?
- Will new walking routes to Willard, Lincoln, Dawes and Walker need crossing guards, and who pays (the district or the City)?
- How many preschoolers lose busing under the new Preschool for All rule, and how will attendance be protected for families just above the income line?
- Which bus aide assignments are “non-mandated,” and on which routes?
Sources
- D65, FY28 Public Financial Plan Summary, October 7, 2026 (section 5)
- D65, Financial Projection Assumptions
- D65, Transportation numbers, FY28 and Utilization table
- D65, School Scorecard Logic and FY27 Baseline Scorecard raw values
- D65, FY28 Tentative Boundaries map and FY27 Elementary Bus Zones map (hazard roads, crossing guards, bus zones, school locations)
- D65, “A Sustainable Path Forward,” Board presentation, October 13, 2026 (slides 32, 35)
- OpenStreetMap contributors, Evanston street and path network, extracted October 15, 2026 (ODbL)