Are Evanston families leaving District 65 for private school?
It is one of the most common explanations you will hear for District 65’s shrinking enrollment, at coffee shops, at board meetings and in the comments under every article: everyone is pulling their kids out for private school.
It is an understandable thing to believe. You watch a family you know leave in June, then another. What you cannot see from your own street is what is happening at the schools you assume they went to.
We went and looked. The short version is that the private schools in our community are shrinking too.
- Down 24% — District 65 enrollment in grades K-8, 2015-16 to 2025-26
- Down 9% — private school enrollment inside our district’s boundary over the same years
Both are shrinking. One is shrinking far faster.
District 65 enrolled 7,371 children in grades K-8 in 2015-16. This year it enrolls 5,406. Private schools inside the district’s boundary enrolled about 1,035 children in grades K-8 in 2015-16, and about 938 in 2025-26.
Both went down. The district went down about two and a half times faster.
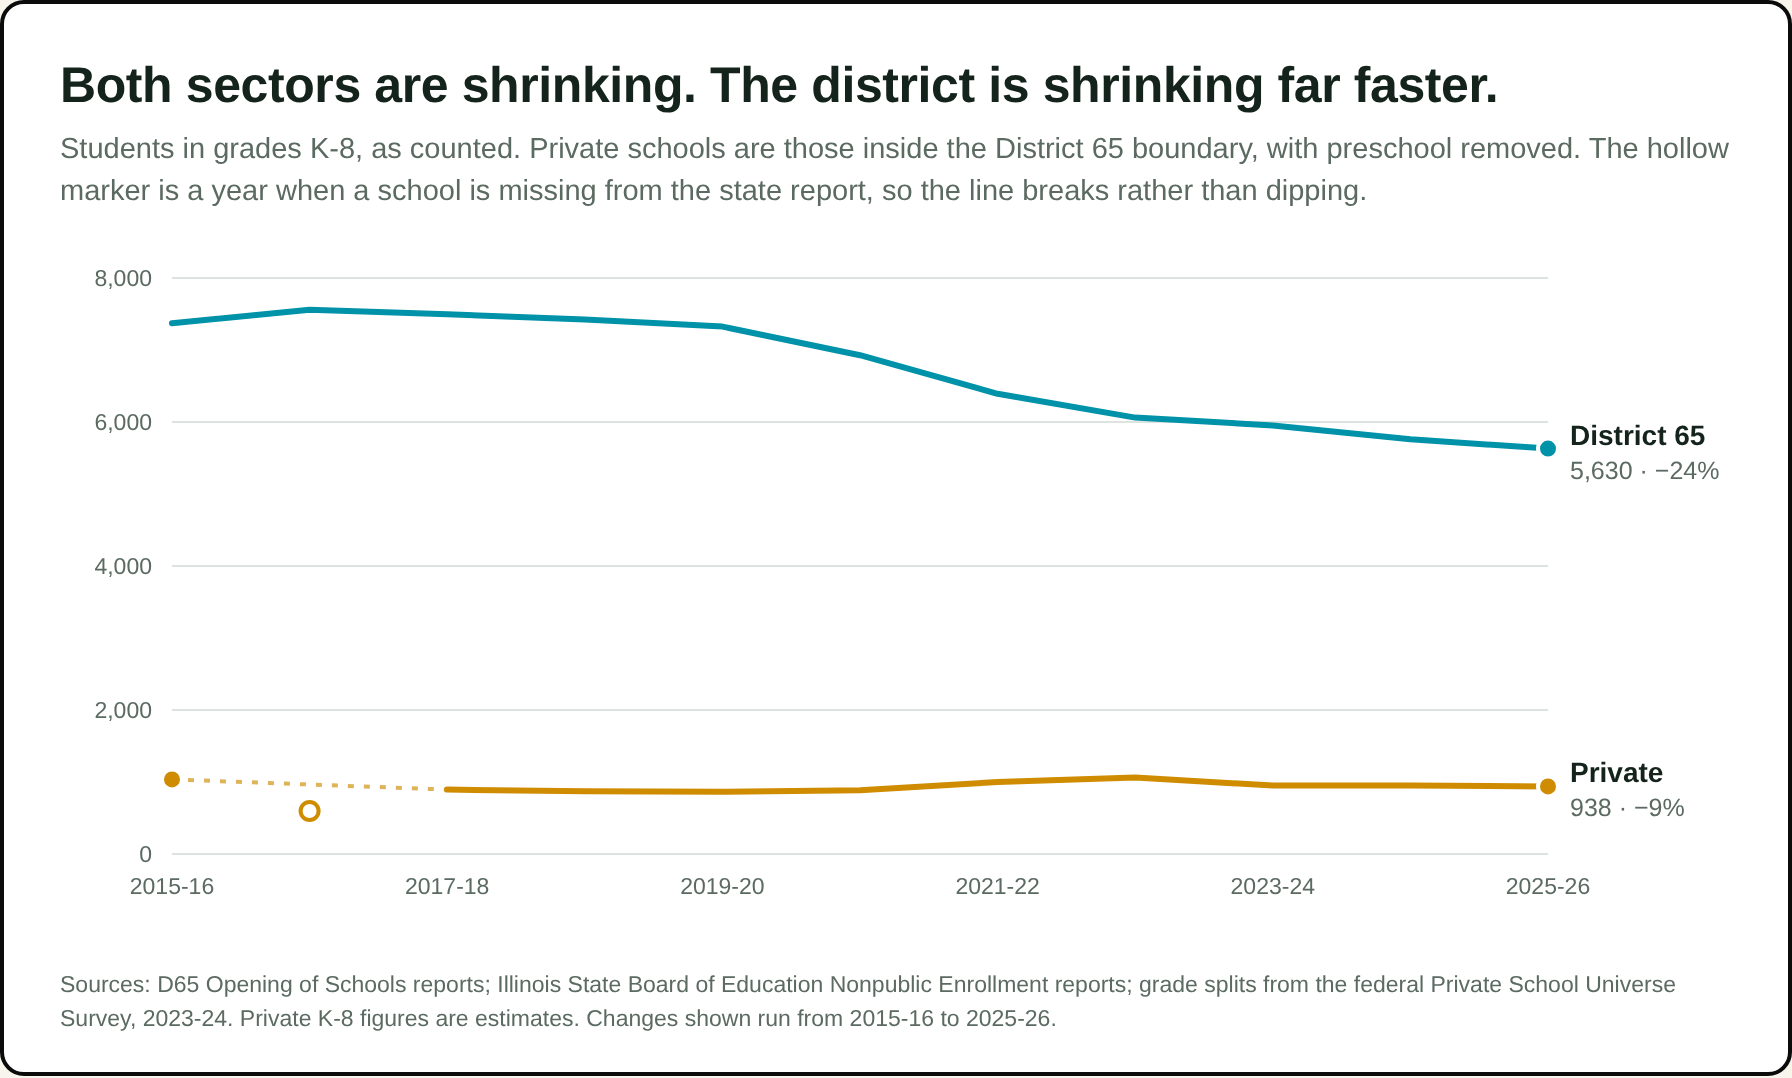
If families were leaving District 65 for private schools in our community, those schools would be growing. They are not.
Did the pandemic send families to private school?
Partly — and the timing is more specific than the shorthand suggests.
The first pandemic year does not fit the story at all. In 2020-21, when District 65 was remote, the district lost 396 students in grades K-8. Private enrollment inside the boundary rose by about 22. Wherever the other children went, it was not to private schools here.
A large share of that first-year drop was families holding children back from kindergarten rather than switching schools. District kindergarten fell from 768 children to 631 in a single year — something that happened across the country that fall.
The two years after remote learning do fit it. Private K-8 enrollment rose to about 999 in 2021-22 and peaked around 1,061 in 2022-23 — roughly 198 students above where it had been in 2019-20, an increase of about 23%. That was a real shift and it is worth saying so plainly.
But District 65 lost 1,263 students over those same three years. A private gain of 198 accounts for about one student in six of what the district lost, measured at the single most favourable moment for the theory.
Has that increase reversed?
In student numbers, largely yes. In percentage terms, no. Both are true, and the reason is worth understanding, because the two statistics get used to argue opposite things.
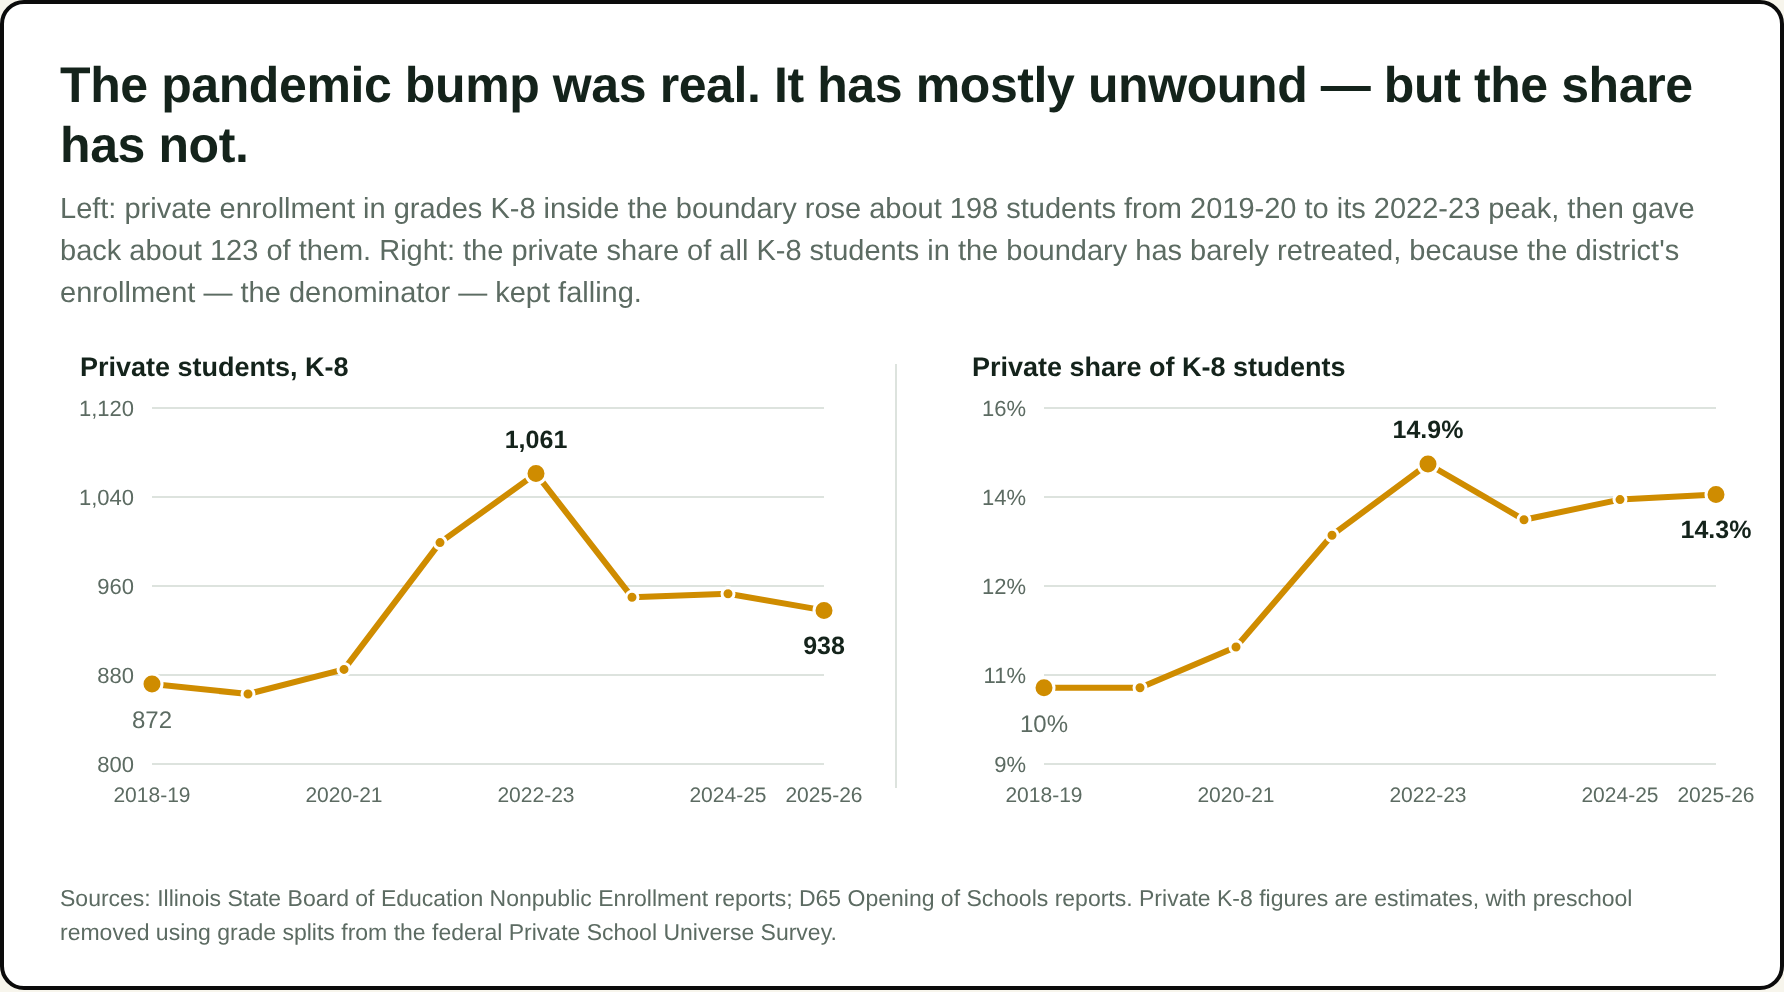
The count rose by about 198 and has since given back about 123 of them. Private K-8 enrollment is now about 75 students above where it sat before the pandemic.
The share — private schools as a percentage of all K-8 children in the boundary — went from about 10.5% before the pandemic to a peak of 14.9%, and sits at 14.3% today. It has barely come back.
How can the share stay high while the count falls? Because a percentage has a bottom half. Private enrollment fell by 123 students from its peak. District enrollment fell by 432 over the same three years. When the larger number shrinks faster, the smaller one’s share goes up even as it loses children of its own.
This matters for how you read what other people tell you. Anyone pointing at the rising private share as proof of surging private demand is mostly pointing at District 65’s decline. Anyone pointing at the falling private count to say nothing happened is missing a real pandemic-era shift that has largely, though not entirely, unwound.
Could private schools absorb this many children anyway?
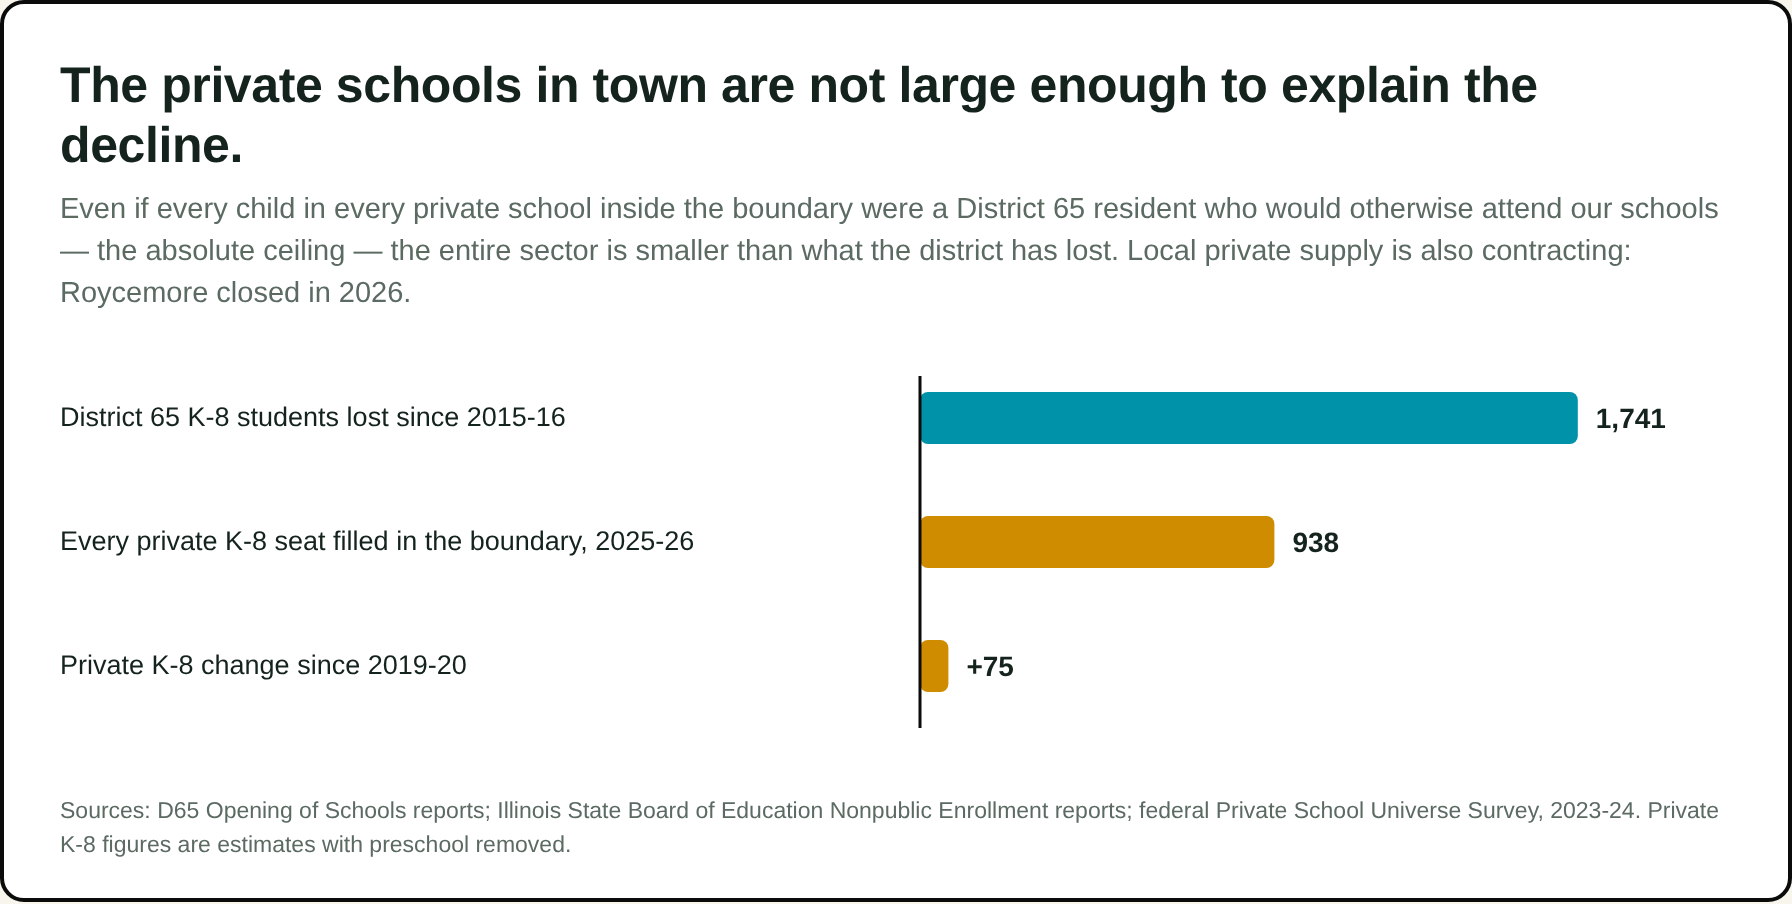 Even at the absolute ceiling, the entire local private sector is smaller than what the district has lost.
Every private school inside our boundary together educates roughly 938 children in grades K-8. District 65 has lost about 1,750 since 2015-16. Even if every single one of those private school children were an Evanston family who would otherwise be in our schools — which they are not, since these schools draw from Wilmette, Skokie and Chicago too — the entire sector is smaller than the loss.
So where did the children go?
Mostly, they were never here.
District 65’s kindergarten class has fallen from 820 children in 2015-16 to 529 this year — down 36%. Those children did not transfer anywhere. They were never enrolled. Fewer young families are arriving in Evanston and fewer children are being born here, and that shows up first in kindergarten and then works its way up one grade at a time.
Some families do leave mid-stream, and that is real. Classes that started kindergarten before about 2015 reached middle school at essentially full size. More recent classes arrive at middle school at 84% to 92% of their original size. Some of that is families moving away for reasons that have nothing to do with schools, some is private school, some is homeschooling. (One caution: the district changed how it counts certain special education students in 2022-23, which makes recent classes look slightly smaller than they are.)
Both things are happening. One of them is several times larger than the other.
Why we think this matters
Because the district is deciding which schools to close, and the explanation you accept changes what you think the right answer is.
If families are fleeing for private school, the fix is to win them back, and closures look like a death spiral that drives more of them out. If the children were never born here in the first place, the district is sized for a community that no longer exists, and the conversation has to be about doing right by the families who are here — which schools, on what criteria, with what support for the children who move.
There is one more thing worth saying. Published tuition at the private schools in and near our boundary runs from about $9,255 a year to about $37,800. Whatever you think about families who choose private school, that is not a door open to most households in Evanston. When enrollment falls because children leave rather than because they were never born, the families able to leave are disproportionately those who can pay. Over time that concentrates in our schools the children with the greatest needs and the fewest alternatives — which is exactly why the question of which school closes, and what happens to the children who move, deserves more care than it is getting.
How we got these numbers, and what they can’t tell you
We would rather you trust these figures than simply accept them, so here is what sits behind them and where they are weak.
Where they come from. District enrollment comes from District 65’s Opening of Schools reports and its October 1, 2026 count. Private enrollment comes from the Illinois State Board of Education’s annual Nonpublic Enrollment reports, which list private schools under our district.
One real complication. The state’s report gives one total per school, which it does not verify, with no breakdown by grade — and most of these schools run preschool programs. Comparing those totals to District 65’s K-8 counts would overstate the private side, in one case badly: of Chiaravalle’s 333 students, 135 are pre-kindergarten. So we used the federal Private School Universe Survey, which does publish enrollment grade by grade, to strip preschool out of each school’s total. That figure is measured for four schools and estimated for the rest. The private numbers on this page are careful estimates, not counts. The weakest one is the Academy at St. Joan of Arc, the third-largest school in town, for which no federal grade breakdown is published.
What this data cannot see. It counts schools inside our boundary, not Evanston residents. A family choosing Baker Demonstration School in Wilmette (148 students, not all Evanston) does not appear here. Neither does homeschooling, which grew after 2020. And some children at Evanston private schools live elsewhere and would not be D65 students anyway.
The private schools in our own community have empty seats too, and they are not big enough to explain a loss of this size.
What would settle it. District 65 records a destination when a family withdraws. Those records, released by year and school, would answer this question directly. We have asked and will update our analysis when we have more information..
Sources
- District 65 Opening of Schools reports; District 65 School Enrollments, October 1, 2026.
- Illinois State Board of Education, Nonpublic Enrollment reports, 2010-11 through 2025-26.
- U.S. Department of Education, National Center for Education Statistics, Private School Universe Survey, 2023-24.
- Evanston RoundTable, “Roycemore cancels 2026-2027 school year,” July 15, 2026;
- Tuition figures from published school profiles, list prices before financial aid.